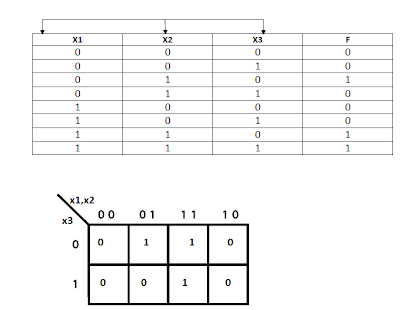
The K-Map can also be described as a grid-like representation of a truth table. The rows and columns correspond to the possible values of the function's inputs. Each cell represents the outputs of the function for those possible inputs.
Figure 1 : It show trusth tablewith three input and one output.
X1, X2, X3 as input
F as output
Figure 2 : It show k-map
KMaps can be applied to expressions of more than two variables. We simply extend KMaps for two variables to three variables, as indicated by Figure 1.
Step 1 :
To use k-map, we must draw a truth table,
X1, X2, X3 is input in truth table. F is output in truth table.
F = X1' X2 X3' + X1 X2 X3' + X1 X2 X3
F = x1 x2 + x2 x3'


No comments:
Post a Comment